September 25, 2018

The Visualize This! Challenge is back! Now in its third year, this Canada-wide competition celebrates the innovative ways visualization can help researchers explore datasets and answer important scientific questions. Visualize This! is your chance to challenge your creativity, experiment with new visualization tools, and contribute to the growth of data visualization in Canada!
This year’s Visualize This! Challenge is hosted by WestGrid, a regional partner of Compute Canada, and led by the Compute Canada Visualization Team. They’re looking for your innovative solutions to transform a contributed dataset into a visualization that enables better observation, understanding, and insight from the data. All entries must be reproducible and use 3D open-source visualization tools.
The 2018 Challenge
This year the Visualize This! Challenge is comprised of two separate competitions:
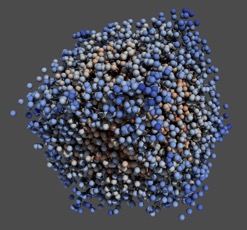
- a scientific visualization challenge based on a molecular dynamics simulation dataset; and
- a humanities visualization challenge based on a dataset from The Orlando Project.
The two competitions will run independently from each other, with first / second / third prizes awarded in each track. You can choose to work with one or both datasets. The datasets will be available for downloading from October 1 and submissions are due no later than November 30 (midnight PST).
Prizes
To be eligible for a prize, you must be registered as a participant. Register here.
A few of the prizes up for grabs include:
- High-capacity external SSD drives
- Your visualization showcased on the websites of Compute Canada, WestGrid, Compute Ontario, Calcul Québec, and ACENET
- An opportunity to present to the research community at an upcoming Compute Canada/WestGrid event
- Free registration and subsidized travel to a WestGrid 2019 Research Computing Summer School
How to Participate
- Register your interest.
- Spread the word using #vizthis2018
- Starting on October 1, download one of the two datasets and start working on your visualization
- Final solutions must be submitted via email no later than November 30, 2018 (11:59 pm PST)
Judging
Submissions will be reviewed by members of the Compute Canada Visualization Team and points will be given for:
- interactive visualizations,
- visualizing the 3D multi-scale nature of the data,
- online presentation in a browser, and
- clear innovative display of multiple variables.
More Information
Visit the Visualize This! Challenge website for complete details or email questions to Alex Razoumov – alex.razoumov@westgrid.ca.
Help us spread the word and share this with anyone else you think is up for the challenge!
